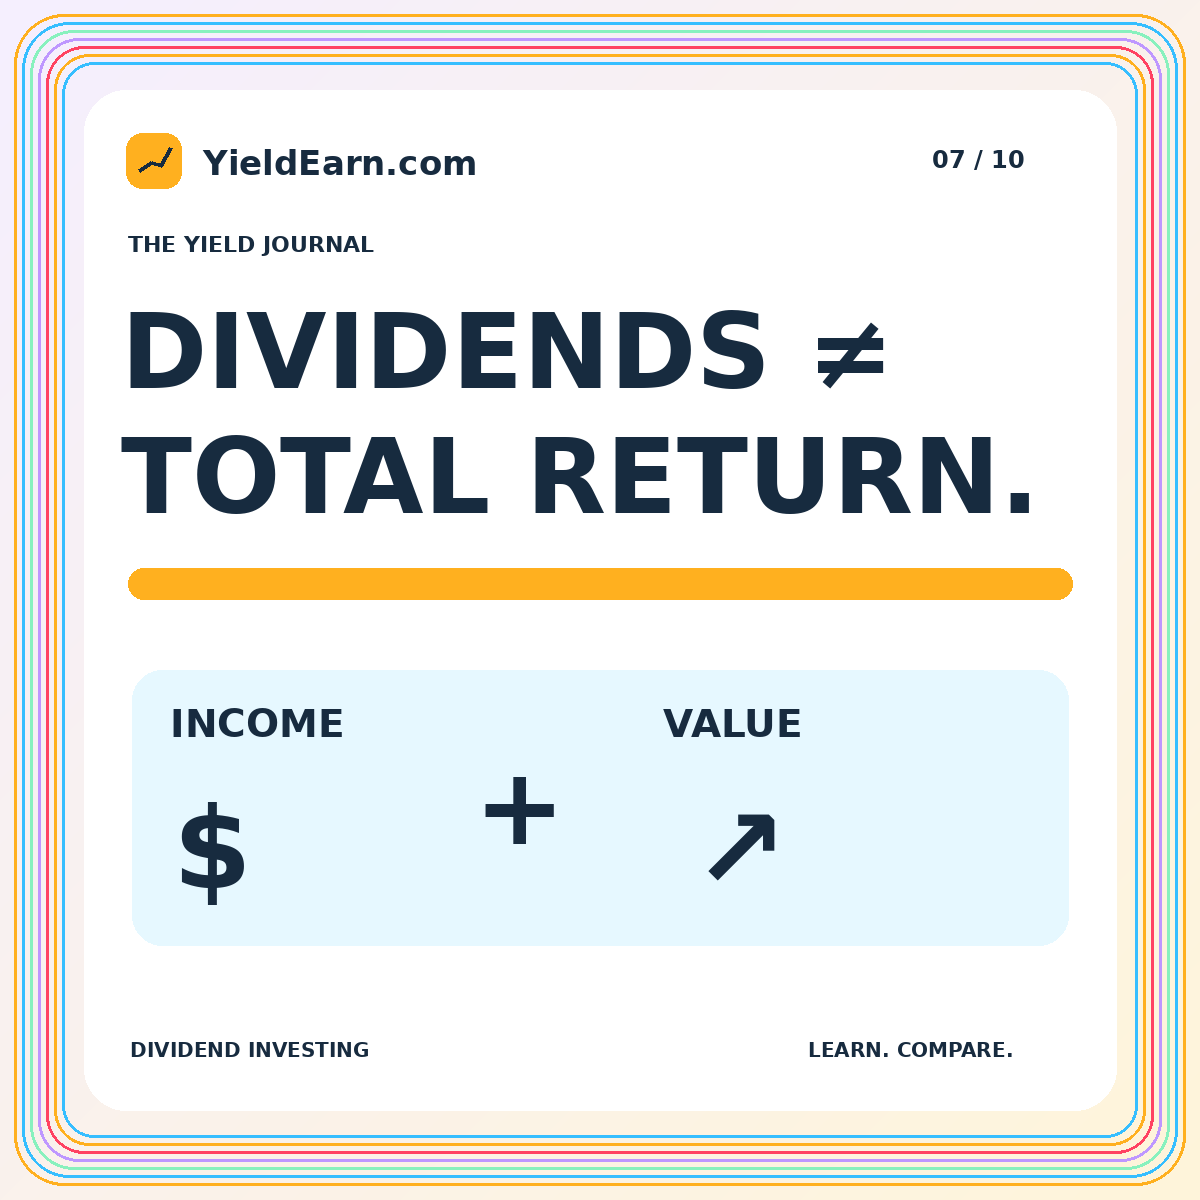
A dividend arriving in your account is easy to notice. A change in the value of the shares producing it can feel less tangible, especially when you do not sell. But both belong in the investment's economic result. Dividend yield describes a relationship between a payment and a price; total return asks what happened to the investment as a whole.
This distinction is central to evaluating dividend-paying shares without confusing income with a guaranteed gain. The examples below use invented companies and assume no taxes or fees unless stated otherwise. Start with the dividend investing guide for the wider framework. This article focuses on the arithmetic and the decisions that different measurements can encourage.
Define the dividend before calculating its yield
A dividend is a distribution from a company to its shareholders. Payments can differ in form and frequency, and a previous payment does not guarantee a future one. The Investor.gov overview of stocks explains dividends alongside ownership, price appreciation, and the possibility of investment losses. Owning dividend-paying stock still means owning an investment whose value can decline.
Before using a yield figure, identify the dividend amount being annualized. Is it the total actually paid during the previous twelve months, or a projection based on the most recent regular payment? Does it include a special distribution? These choices can create different numbers for the same shares. A yield without a definition may look precise while leaving the most important input unclear.
Calculate a basic dividend yield
Suppose a fictional company pays $2 per share over a year and its current share price is $50. Dividing $2 by $50 gives a 4.00% dividend yield. That calculation describes annual dividends relative to the price used. It says nothing by itself about the next year's dividend, the next share price, or whether the company can maintain the payout.
Now let the share price fall to $40 while the assumed annual dividend remains $2. The yield becomes 5.00%. The percentage increased even though the payment did not. A rising yield can therefore reflect a falling denominator rather than improving cash income. This is why the headline number should lead to a question about its inputs, not an automatic conclusion that the opportunity has improved.
Add price change to see the full result
Imagine buying one share for $50, receiving $2 in dividends during the year, and ending with a share worth $45. Ignoring taxes, fees, and reinvestment, the total dollar result is negative $3: a $5 decline in value offset by the $2 payment. Dividing negative $3 by the $50 starting value gives a negative 6.00% holding-period total return.
The dividend was real, but it did not make the investment profitable over that period. If the ending share price were instead $53, the $3 price increase plus the $2 dividend would produce a $5 gain, or 10.00%. These are hypothetical endpoints, not forecasts. Together they show why the same initial dividend yield can accompany very different total returns.
Receiving cash does not make it free money
A distribution moves value from the investment to the shareholder. It should not be added to an unchanged theoretical company value as though no resources left the business. Actual market prices are affected by many forces, so a simple one-day price observation is not a clean experiment. The broader point is accounting discipline: track both cash received and the value of what remains.
A useful mental exercise is to compare two versions of the same household balance sheet immediately before and after a hypothetical transfer. In one version, value sits inside the investment; in the other, some sits as cash. Moving it between locations does not by itself create new wealth. Future business performance and the investment's price still matter to the overall result.
Keep yield on cost in its proper place
If you originally bought shares for $25 and they now pay $2 annually, the dividend relative to your historical cost is 8.00%. That is often called yield on cost. If the shares currently trade at $50, their current dividend yield is still 4.00%. Both ratios can be calculated correctly because they use different denominators.
Yield on cost can help describe your historical purchase, but it does not answer what the shares offer relative to their current market value. It should not prevent a fresh assessment of risk or alternatives. A personal purchase price does not bind the company to a payment, and it does not change what another buyer would pay today. Label the measure clearly whenever you use it.
Reinvestment changes the path of ownership
Reinvesting a dividend buys additional shares instead of leaving the payment as cash. Those shares then participate in future price changes and distributions. The result depends on the prices at which reinvestment occurs and on subsequent company performance. Reinvestment is not a device that transforms an uncertain stock into a guaranteed compounding account.
For a transparent illustration, track the number of shares after each reinvestment and value the ending holding at the ending price. Do not count a reinvested dividend once as cash still available and again inside the value of the extra shares. That double-counting can substantially exaggerate an apparent return. A cash-income plan and a reinvestment plan should be modeled separately before comparing them.
A spending plan needs a fallback
Someone using dividends for living costs faces a practical question beyond the yield calculation: what happens if a payment is reduced or omitted? Build a hypothetical lower-income case and identify which expenses would be affected. The purpose is not to predict a dividend cut; it is to find out whether the plan relies on a distribution that has not been promised unconditionally.
Also distinguish payment frequency from spending frequency. Quarterly distributions do not automatically align with monthly bills. A calendar of expected receipts can help reveal timing gaps, but mark future amounts as uncertain. The timeline planning guide explains how a spending schedule can be evaluated separately from a portfolio's advertised income rate.
Compare funds and individual shares carefully
A dividend-oriented fund and a single dividend-paying company have different holdings and cost structures. The fund's distribution figure may reflect the underlying portfolio and its distribution policy, while an individual company's dividend depends on that business. Do not assume the word “dividend” creates a uniform product category with one level of risk or one type of payout.
Read the stated calculation period and distribution definition before comparing fund figures with individual-share yields. Check whether costs are already reflected in the measure used. Then evaluate concentration and the composition of the holdings rather than relying on the number of securities alone. A collection of similar businesses can still share important vulnerabilities even when it contains many names.
Use total return without ignoring your actual purpose
Total return is important, but it does not mean every investor has identical cash-flow needs. A person who values distributions may reasonably care about when cash arrives. The analytical mistake is not caring about income; it is treating income as the entire economic result. Evaluate the payment pattern and the changes in investment value together.
A useful review can have separate lines for cash received, ending market value, costs, and any new contributions or withdrawals. That format shows what happened without forcing all the information into one ratio. It also makes it easier to distinguish a disappointing investment result from a change caused by adding or removing your own money during the period.
The practical takeaway
Dividend yield is an income-to-price ratio. Total return includes the change in investment value as well as distributions, under the calculation's stated assumptions. A high yield can coexist with a negative return, and a modest yield can coexist with a positive one. Neither outcome can be determined from the initial percentage alone.
Before making a dividend comparison, identify the payout definition, price date, business or fund risks, and intended use of the cash. Then check the whole result. Our dividend yield trap guide builds on this foundation by asking whether an attractive-looking payment is supported by a durable business rather than just a depressed share price.